Research
The guidance on this site rests on three-dimensional simulations of liquid and vapour flowing together, validated against laboratory experiments in ammonia and then used in parametric studies of several hundred cases.
How the simulations work
The simulations treat the liquid and the vapour as a single mixture that fills the pipe, while keeping track of how much of each phase is present at every point. Where the phases are separated, as in a stratified layer or a slug, the method behaves like an interface-tracking method. Where they are mixed, as behind a slug, it describes the mixture. One velocity, one pressure and one temperature are computed for the mixture.
Each phase has its own equation of state: an ideal-gas law for the ammonia vapour and the Tait equation for the liquid. Both phases are compressible, so pressure waves travel at the right speed in the liquid, the vapour and the mixture. The phases are not forced into equilibrium: vapour can be superheated and liquid subcooled. Phase change is added through separate models:
- Thermally limited condensation, where heat has to be removed for vapour to condense: at the liquid surface, on vapour bubbles mixed into the liquid, and on the pipe walls.
- Inertial phase change (cavitation and flashing), where the pressure changes so quickly that the liquid boils or the vapour collapses at nearly constant temperature. This is needed for a slug to pass through bends at high speed and for the final collapse of the trapped vapour.
The equations are solved with a finite-volume, pressure-based method in the TransAT code. The formulation is described in Labois and Narayanan (2017), and the cavitation model in Narayanan (2021).
Validation against the RP-970 experiments
The ASHRAE research project RP-970 (Martin et al., 2007) carried out hydraulic-shock experiments in a 20 ft long, 6 in. Schedule 80 horizontal pipe, partly filled with subcooled liquid ammonia and closed by an end cap. Hot ammonia gas was injected through a downcomer at the other end. Twelve of these tests were selected for the validation in ASHRAE RP-1569: eight at low liquid temperature and four at high liquid temperature, with liquid levels from 26% to 78% of the pipe diameter. Two of the twelve tests produced no shock.
Each simulation, run with the measured inlet flow of the test, gives two results that can be compared with the measured shock: the peak pressure at the end cap, and the velocity of the slug. From the slug velocity follows the slug Joukowsky number, , with averaged over the travel of the slug (see Mechanism). The simulations reproduced:
- the slug velocity within about 5–20% for most cases;
- the timing of the shock;
- the shape of the pressure pulse: a rise and fall within about 6–7 ms, decreasing away from the end cap;
- the distinctive patterns of individual tests, such as several separate shocks or closely spaced oscillations.
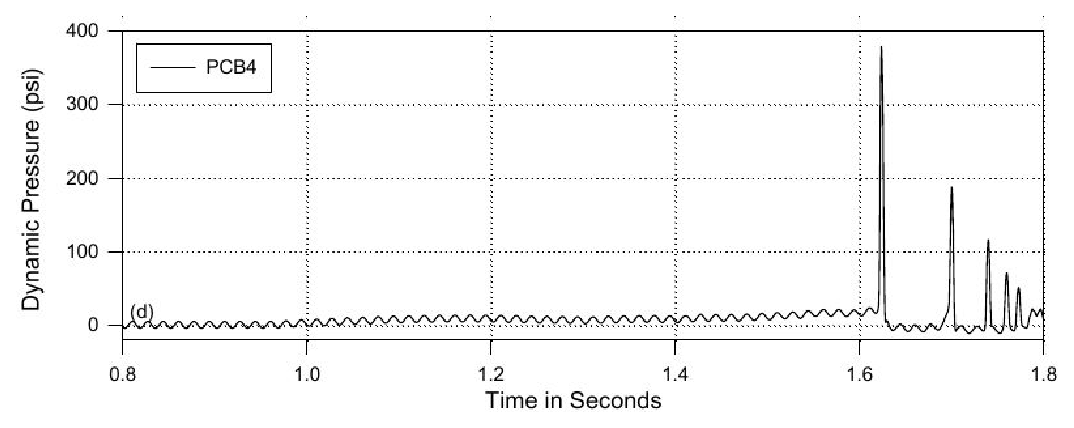
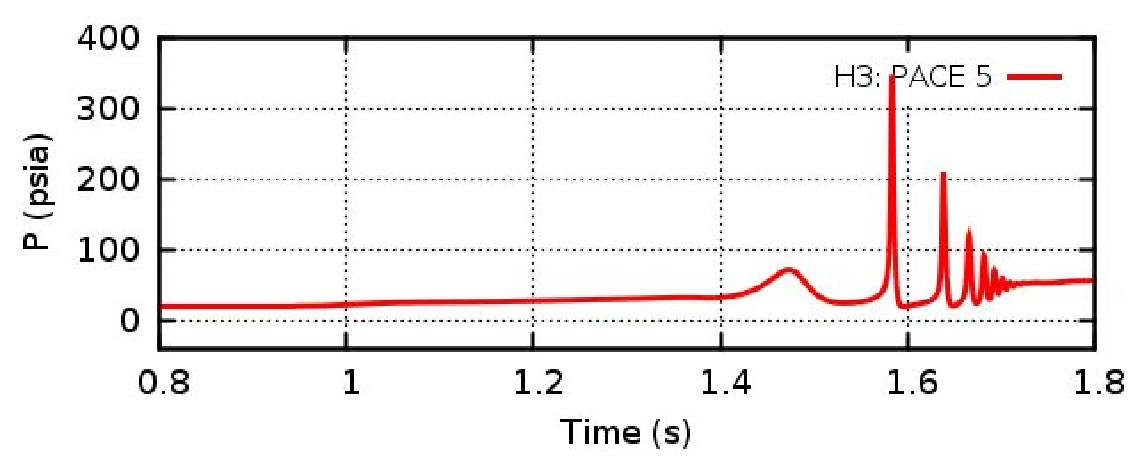
Pressure at the end cap in test H3: measurement (left) and simulation (right). A main shock is followed by several smaller ones, each from the collapse of an isolated vapour bubble; the model captures this sequence of multiple collapses. Source: Narayanan, Thomas and Lakehal (2020), ASHRAE Transactions, Fig. 10.
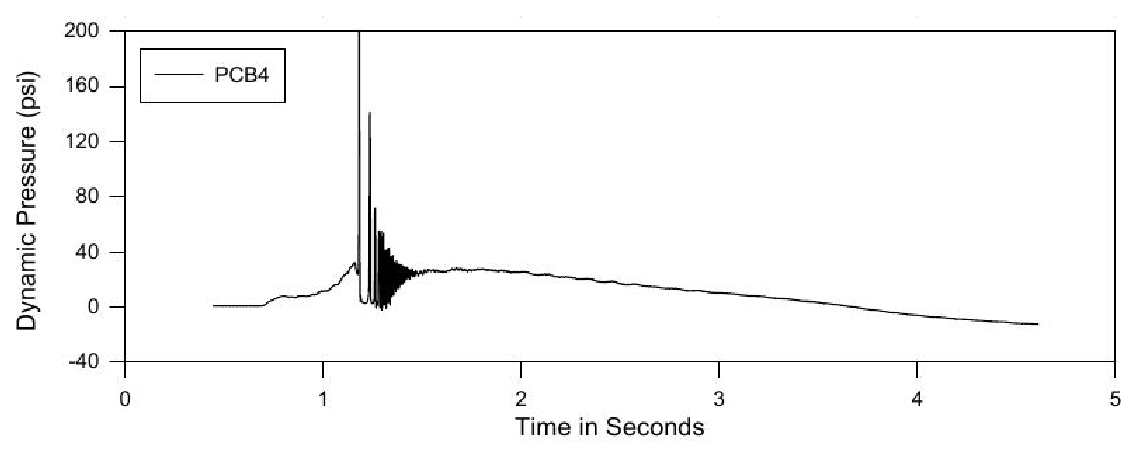
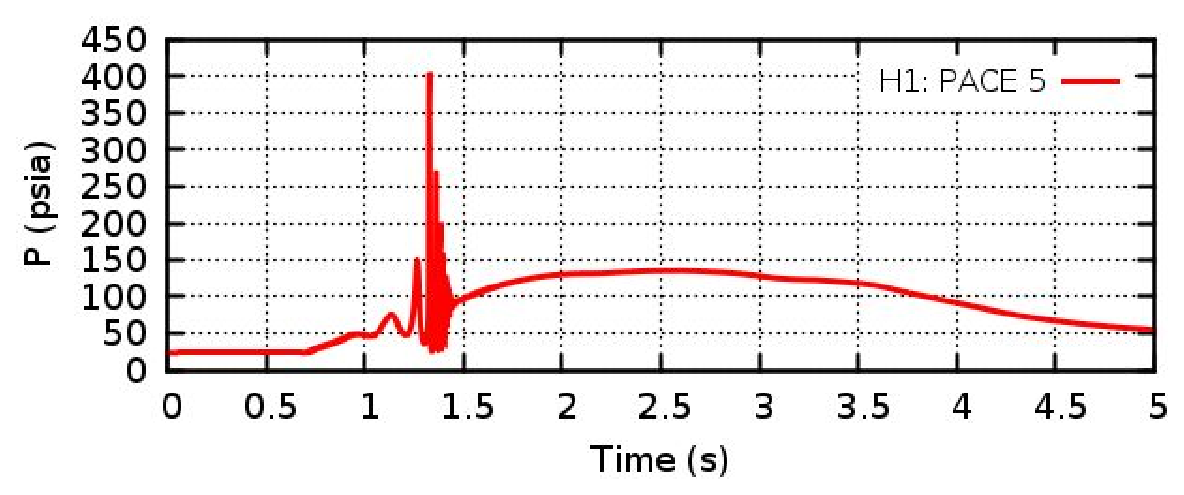
Pressure at the end cap in test H1: measurement (left) and simulation (right). Instead of one shock, the pressure shows closely spaced oscillations; the model reproduces this pattern at almost the right time. Source: Narayanan, Thomas and Lakehal (2020), ASHRAE Transactions, Fig. 10.
The peak pressure turned out to be erratic. It depends on the details of the final collapse of the vapour pocket, and repeat runs of the same RP-970 test differed by 15–20% in peak pressure. The slug velocity is much more reproducible, and the slug Joukowsky number followed the measured shocks far better than the simulated peak pressure did:
| Quantity from the simulation | Average error | Correlation with the measurements |
|---|---|---|
| Peak shock pressure | 43–61% | 45–66% |
| Slug Joukowsky number | 18–33% | 73–85% |
Comparison with the twelve RP-970 tests; ranges over the model settings and grids. “Correlation” measures how well the simulated values follow the measured ones from case to case (100% = perfectly). Source: IIAR research report (2022).
Nearly all Joukowsky numbers fell within ±25% of the measured shock. The design-basis studies below therefore use the slug Joukowsky number as the measure of the shock potential.
The comparison also showed the limits of the approach. No single model setting matched all twelve tests: two cases gave no shock in the simulation, and several were under-predicted by about a factor of two. The balance between the condensation modes, in particular condensation on the pipe walls, could not be fixed from these experiments alone.
Design basis for fast-acting and motorized valves (IIAR, 2022)
The first IIAR project set out to give a design basis for hot-gas and wet suction pipework: the type and size of the hot-gas valve, the effect of trapped liquid, and the suction temperature. The layout was generic: hot gas entering through an elbow into a horizontal pipe with a layer of saturated liquid, closed by an end cap. The hot-gas valve was fast-acting and choked.
| Set | Runs | Parameters varied |
|---|---|---|
| Main set | 96 | Pipe 4 and 6 in.; length 13 and 40 ft; liquid level 25, 50 and 75% of the diameter; evaporating temperature –45 and –25 °F; hot-gas pressure 70 and 100 psig; valve 1½ and 2 in. |
| Warmer evaporator | 48 | As the main set, at –5 °F |
| Small pipe | 16 | 2 in.; liquid level 50%; two lengths; –45 °F; eight flow rates |
| Hot-gas temperature | 4 | 4 in.; one length; four hot-gas inlet temperatures |
Parameter matrix of the 164 simulations. Source: IIAR 2022 Technical Paper #1.
The main trends were: longer pipes gave stronger shocks; a liquid level around half the diameter gave the strongest shocks; warmer evaporating temperatures gave weaker shocks; and the shock rose by about 13 psia per kelvin of hot-gas inlet temperature. From the results, a correlation was built that predicts the slug Joukowsky number from the pipe diameter and length, the evaporating temperature, the hot-gas flow and its temperature. For a liquid level of half the diameter, the most severe case and the one used in the tools on this site, the fit to 67 simulations has a correlation of 94% with the simulated values. The critical flow for slug formation from Martin et al. (2007) was confirmed. Simulations of motorized valves showed that an opening time well above the slug travel time removes most of the shock (see Guidance).
When applied to the Wiencke accident, the correlation followed the trends correctly but under-predicted the shock: 1,270 psia against 3,500 psia from the full simulation. The main difference was that in the accident the slug was already formed in a trap, rather than formed from a liquid layer. This led to the second project.
Pre-formed slugs and hot-gas valve sizing (IIAR, 2024)
The second IIAR project studied a slug that sits in a liquid trap and is driven by hot gas into nominally dry suction piping. The layout was a vertical downcomer, a trap filled with liquid, a transition of six diameters, and a horizontal pipe of 100 diameters closed by an end cap. The slug was ten diameters long.
Preliminary runs settled the set-up. In a completely dry pipe, the gas ahead of the slug was compressed, the slug bounced back before reaching the end cap, and there was no strong shock once the pipe was longer than about 50 diameters: a dry pipe does not offer enough surface for the vapour to condense. A thin liquid layer of 0.2 diameters removed the rebound. Changing the pipe length from 50 to 150 diameters changed the peak pressure by 38% but the slug Joukowsky number by only 15%, another reason to use the latter.
The parametric study covered pipe diameters of 1, 2, 4, 6 and 10 in., evaporating temperatures of –45, –30 and –20 °F, and hot-gas flows from one sixth to sixteen times the critical flow, in 90 simulations. Eight further runs at 12 and 16 in. were kept aside to test the correlation.
- Critical flow. A densimetric Froude criterion gives the hot-gas flow below which the slug collapses under its own weight before it can be driven along (see Guidance). No shock formed at half this flow, and every case at twice this flow produced a shock.
- Correlation. A correlation for the slug Joukowsky number was fitted to the 1–10 in. results. On the 12 and 16 in. cases it was not fitted to, the average error was 14% and the correlation 93%. At a fixed pipe size and evaporating temperature, Ju grows roughly as the gas velocity to the power 0.8.
- Wiencke accident. The new correlation predicted the high-shock cases of the accident much better than the 2022 one.
- Valve sizing. Present hot-gas valve sizing ignores the surge when the valve opens. The study gives a basis for sizing quick-opening hot-gas valves from the critical flow (see Guidance).
- Motorized valves. Where a slug can be pre-formed in a trap, the correlation also gives the slug velocity from which the opening time of a motorized valve is chosen, as for a liquid layer (see Guidance).
Related work
Compressible multiphase formulation (Labois and Narayanan, 2017). The governing equations used in all the work on this site. Liquid and vapour of the same substance have separate equations of state, so that the method covers both compressible and incompressible flow, with or without a sharp interface, and does not produce spurious pressure oscillations at the boundary between the phases.
Flashing and cavitation (Narayanan, 2021). Adds phase change driven by rapid pressure changes and validates it against flashing flow in a nozzle. It shows that flashing under strong depressurisation is far from equilibrium, and that thermal effects near saturation must be included. This model allows the slug to pass through bends and describes the final collapse of the trapped vapour.
Pulp-digester blow line (Carlson, Narayanan and Lakehal, 2023). Applies the same model outside refrigeration, to a liquor blow from a pulp digester through a blow line to a blow tank. No vapour is injected: the liquor flashes at a junction and recondenses further downstream, sending a condensation front back onto the junction. Filling the line with liquid before the blow removed the shock.
Wall condensation (Narayanan, 2025). A simplified wall condensation model for pure substances that combines dropwise and film condensation. It replaces the wall condensation model used in RP-1569, in which an error was later found; with the corrected model, condensation on the walls is only a small part of the total.
Publications
Journal papers
- Narayanan C. (2025). A simplified multi-mode wall condensation model for pure substances. International Journal of Heat and Mass Transfer 245, 126993. doi:10.1016/j.ijheatmasstransfer.2025.126993
- Carlson A., Narayanan C., Lakehal D. (2023). Simulation of liquor blow, thrust force, and risk of condensation hydraulic shock in a pulp-digester piping system. ASME Journal of Pressure Vessel Technology 145, 041401. doi:10.1115/1.4062335
- Narayanan C. (2021). Numerical simulation of flashing using a pressure-based compressible multiphase approach and a thermodynamic cavitation model. International Journal of Multiphase Flow 135, 103511. doi:10.1016/j.ijmultiphaseflow.2020.103511
- Narayanan C., Thomas S., Lakehal D. (2020). CFD study of hydraulic shock in two-phase anhydrous ammonia. ASHRAE Transactions 126(2).
- Labois M., Narayanan C. (2017). Non-conservative pressure-based compressible formulation for multiphase flows with heat and mass transfer. International Journal of Multiphase Flow 96, 24–33. doi:10.1016/j.ijmultiphaseflow.2017.07.004
Conference papers
- Narayanan C. (2022). CFD-based design basis for avoidance of hydraulic shock in ammonia pipework systems. IIAR 44th Annual Meeting, Natural Refrigeration Conference, Savannah, Georgia, Technical Paper #1.
- Narayanan C., Wiencke B., Loyko L. (2021). CFD analysis of pipework fracture due to hydraulic shock in an ammonia refrigeration system. IIAR Natural Refrigeration Online Conference, Technical Paper #1.
- Narayanan C., Loyko L. (2019). Predictive CFD modelling of condensation-induced water hammer in two-phase ammonia systems. IIAR Natural Refrigeration Conference & Expo, Phoenix, Arizona, Technical Paper #7.
Research reports
- Narayanan C., Singh J.-S. (2025). Correlation between evaporator suction pipe size and hot gas flow rate for the prevention of hydraulic shock in ammonia refrigeration systems. Technical Paper 2025 RR1, research report extended executive summary. International Institute of Ammonia Refrigeration (IIAR).
- Narayanan C., Singh J.-S. (2024). Correlation between evaporator suction pipe size and hot gas flow rate for the prevention of hydraulic shock in ammonia refrigeration systems. Research project final report. International Institute of Ammonia Refrigeration (IIAR).
- Narayanan C. (2022). Development of a design basis for the avoidance of hydraulic shock in ammonia pipework systems using state of the art CFD modelling. Research project final report. International Institute of Ammonia Refrigeration (IIAR).
- Narayanan C. (2018). CFD study of hydraulic shock in two-phase anhydrous ammonia. Research Project RP-1569, final technical report. ASHRAE.